
How ITS can improve transportation services
The article introduces Intelligent Transportation Systems (ITS) and some applications to everyday life in order to improve the efficiency within transportation domain. In this article you can find an introduction to predictive analytics and data-driven ITS.
Transportation systems involve humans, vehicles, shipments, information technology, and the physical infrastructure, all interacting in complex ways. These systems are commonly considered as an indispensable part of human activities. Many aspects of transportation systems are uncertain, dynamic and nonlinear, and such systems may be highly sensitive to perturbations.
Intelligent Transportation Systems are defined as “those systems utilizing synergistic technologies and systems engineering concepts to develop and improve transportation systems of all kinds”. Application of ITS ranges from advanced traveler information systems to business vehicle management and from advanced vehicle control systems to advanced urban transportation systems. Moreover by integrating and analyzing multi-source data, new arising services are still coming.
Visualization techniques
A first issue is to visualize data from different sources, indeed in general, an analytic system consists of four main components: data collection, data preprocessing, data query and data analysis and each component requires specialized visualization techniques.
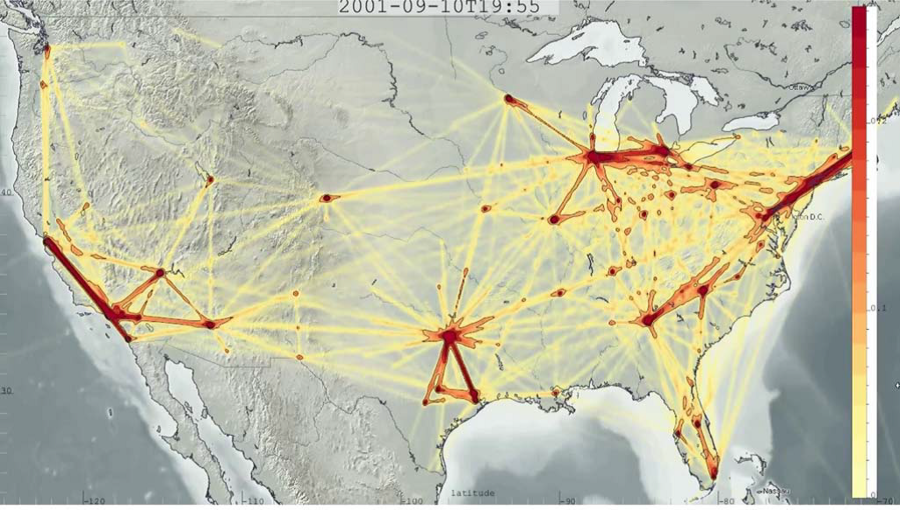
Figure 1 - Density maps of trajectories - Air traffic in the USA [9]
An example is line-based visualization techniques which are designed to display traffic trajectories, roadmaps in a large-scale region, or traffic flow in a distributed network (see Figure 1).
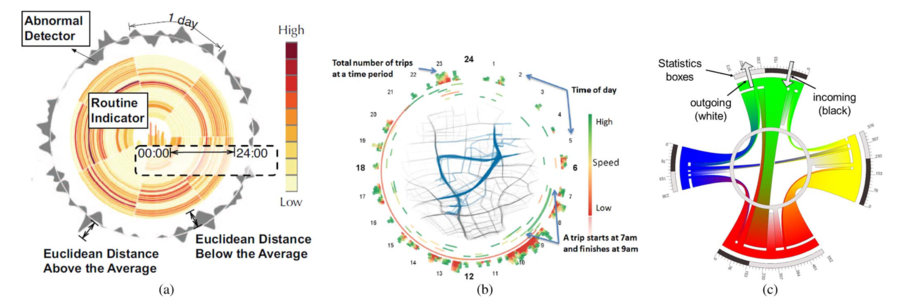
Figure 2 - Density maps of trajectories - Air traffic in the USA [9]
In order to enhance conventional multivariate data visualization techniques, these are integrated with specially designed visual encoding and interaction schemes. For instance, Figure 2 depicts a representation invented to show the distribution of taxis, average speed of taxis and pick-up/drop-off activities on roads. Statistics of attributes of taxis (e.g., speed and vehicle density), value of attributes at each time, and the Euclidean distance against the average are simultaneously illustrated.
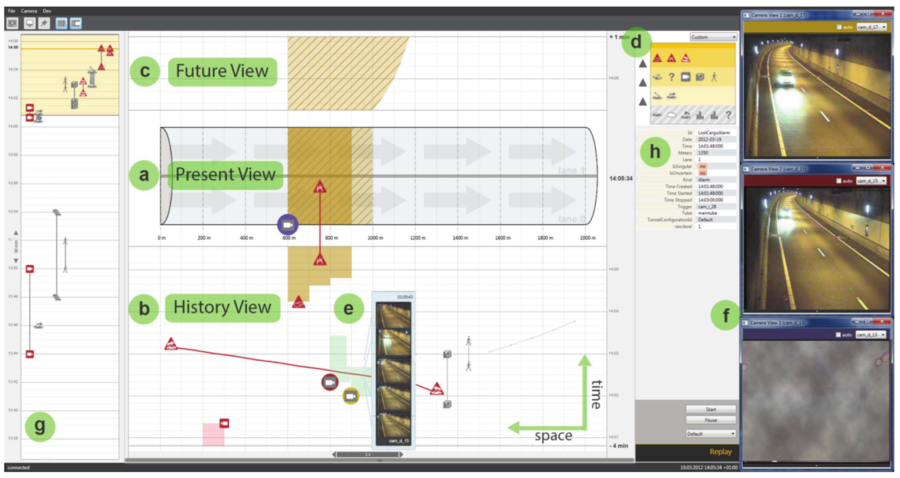
Figure 3 - Visual Monitoring of Traffic Situations - AIVis
Proactive control and management
In recent years, the use of advanced technologies has allowed a significant increase of the available data thanks to the existence and the diffusion of different sensors such as GPS, Laser Radar, Seismic sensor, ultrasonic sensors, metrological sensor and mobile cellular networks. The main issue is to understand how this huge amount of data can become a value-added service for travelers and logistic systems.
Although video devices and multiple sources can generate data of transportation system for a broad scope of application in ITS, it is not sufficient to merely rely on these devices to generate data to serve as input used for traffic control, especially if we consider real-time traffic control and transportation system analysis.
For example, the effective prediction of the occurrence of an accident can enhance the safety of pedestrians by reducing the impact of vehicle collision.
The latest development in ITS exhibits a new trend toward proactive control and management.
To do that, there is a need to learn the intrinsic mechanism of transportation system using both real-time and historical data.
As an example of application, traffic prediction has the ability to improve traffic conditions and to detect candidate congestion points. Traffic congestion is a situation of transportation systems that occurs because of the saturation of road network capacity, due to increased traffic volume or interruptions, and is characterized by slower speeds, increased vehicular queuing, and longer trip times. A research conducted by The University of Vermont, US and supported by Vermont Agencies of Transportation proposes a dynamic real-time traffic prediction system that provides traffic predictions and travel guidance. The real-time traffic data is collected once every five minutes by means of a portable traffic analyzer (i.e., NC-200), and predicts the real-time traffic once every “fifteen seconds”.
The main idea of the prediction model is: the real-time traffic at a particular site associates with time, weather, location, and the previous traffic situation and so on.
The University of Texas (US), Nagoya University (Japan) and Politecnico di Torino (Italy) collaborated at UTDrive project aimed at predicting driver behavior and performance while using speech interactive systems, as well as improve speech interactive systems to accomplish reduced distraction/improved safety for in-vehicle systems.
Research trends show the use of active safety device which complements the traditional passive ones and Collision Avoidance Systems (CAS) are an illustration of such trends. The main objective assigned to these systems is to provide a more reliable description of the traffic scene surrounding the vehicle to vulnerable road users, in pre-crash situations.
In order to support these systems, a technique used to obtain the static map of the environment and its position in the map is simultaneous localization and tracking. The vehicle needs to sense its environment with an array of sensors and the sensory information needs to be used effectively to provide decision support. Challenges involved are the heterogeneous nature of the data and extracting relevant features from the measurements. Typically, sensors of different capabilities are used to gain complimentary information.
This area has been an active research topic in robotics in the last ten years and consists of multiple parts; landmark extraction, data association, state estimation, state update and landmark update. Since individual steps can be achieved using a multitude of algorithms, there is no universally accepted algorithm. Detection and tracking of moving objects form another set of techniques used to obtain information about the dynamic environment in which the vehicle is operating. Recently, there have been many commercial products in the market capable of alerting drivers about lane changes. In such systems, artificial intelligence techniques are used with image processing tools to extract information from 2D and 3D cameras. Since there is a good contrast between the road and lane markings, thresholding of the images was found to be useful and the next step would be a perceptual grouping of the edge points to detect the lane markers of interest.
In this scenario, a recent research activity of Poste Italiane in the area of business vehicle management is focused on the prototyping of a system able to cluster vehicle according their usage and performance.
Assessing and Forecasting Vehicle Performance
In transportation domain, annual costs are expressed by fuel consumption, vehicle maintenance,
insurance policy and vehicle management. A significant part of these costs is highly influenced by working conditions, followed routes, conditions found in urban cycle (stop-start traffic), and which type of vehicle (e.g., Fiat Panda, Fiat Punto, Fiat Doblo’) is chosen for each delivery task. In order to implement a cost reduction strategy, it is possible to adopt several solutions. We can choose to decrease the use of expensive vehicles; to replace the old vehicles or to improve the performance of high-cost vehicles; to increase the number of tasks associated to top-ranked vehicles. Considering a huge vehicle fleet, it is difficult to detect the best strategy. Clustering vehicles on the basis of their performance can help to identify the most suitable solution.
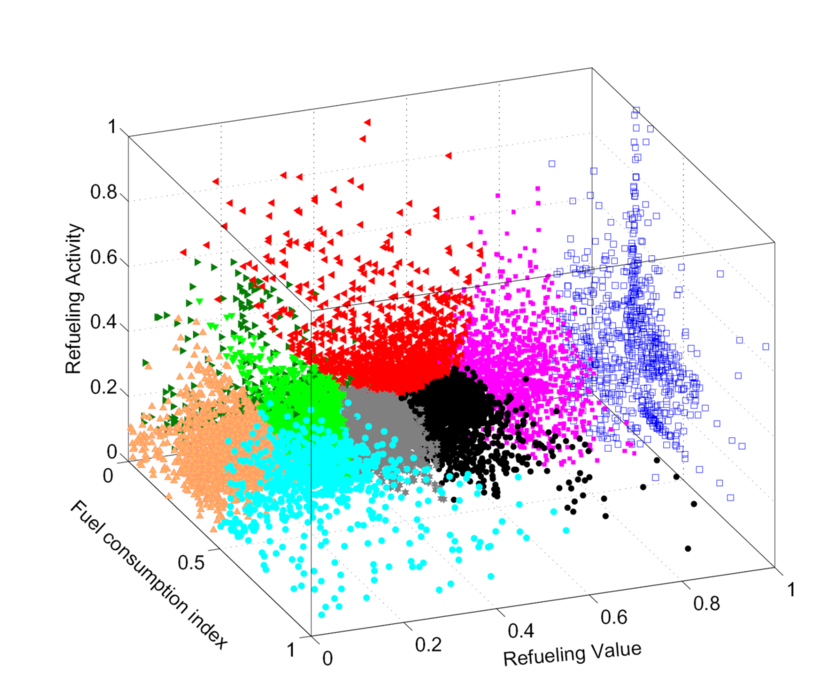
In other words, vehicle clustering aims at grouping together vehicles with the same behavior in terms of cost and fuel consumption. This section describes two predictive indicators, i.e., Vehicle Value and Refueling Activities, and a retrospective index: Average Fuel Consumption Index, which are proposed in a prototype in order to cluster carrier according their usage and performances.
LifeTime Value is a dynamic financial indicator which is adopted in e-Commerce domain, and it depends on the customer’s behavior. This indicator represents an attractive metrics for the definition of marketing strategies because it provides a forecast on future costs and revenues generated by the customer [6]. It represents the user value over its entire lifecycle and can be defined like the sum of the retrospective value (VR) and the prospective value (VP). VR is the current value of the customer (calculated using historical data); while VP is the future value that a customer will have, namely the future earnings the customer will provide to the merchant; this is based on the prediction of future purchases made by the customer through Sequential
Minimal Optimization (SMO), an iterative algorithm based on support vector regression adopted for solving some optimization problems [7].
Lifetime value is applied to Transportation System for the forecasting of the fuel amount for each vehicle. Comparing to e-Commerce definition, the customer are replaced by vehicles and the purchasing by refueling. The aim is to predict the future fuel cost of a vehicle according to its history (Refueling Value).
We define an index called Refueling Activity which allows to assess the vehicle’s usage by measuring the frequency and the number of refueling.
Knowing future activities of vehicles allows to plan a correct cost strategy and support the outlier detection process (i.e., a low number of real refueling with respect to the predicted value could indicate a misuse of the vehicle). We consider the number of refueling for each vehicle in a certain period of time. We use BG/NBD model [8], widely used in the e-commerce domain in order to predict the behavior of customers. This model assumes that after a purchase process, there exists an inactivity period (without purchasing activity) in which the customer uses the item. In our domain, the item is the fuel, the customer is the vehicle, and so the purchasing is the refueling. High value of predicted refueling activities expresses an intense usage or a misuse of refueling process.
Fuel consumption index measures the vehicle’s cost and identifies at the same time the vehicle’s performance. Indeed, it considers the fuel demand related to the followed route.
Grouping together those vehicles with higher predictive activity and value, it is possible to detect the predictive cost and activity; while comparing the fuel consumption index and the predictive route, it is possible to detect very efficient vehicle or cost-consuming carrier.
Conclusions: a new starting point
Analyzing the recent trend on ITS, we can observe how this is a very promising field that can provide wide services to further improve transportation systems. Indeed, the potential services arising from the available new information from Transportation System and the emerging Information Technology application leads to a new starting point of data-driven intelligent services.
References
[1] Nour-Eddin El Faouzi, Henry Leung, Ajeesh Kurian (2011). Data fusion in intelligent transportation systems: Progress and challenges – A survey, Information Fusion, Volume 12,
Issue 1, January 2011, pages: 4-10.
[2] Federal Highway Administration (2003). Data fusion for delivering advanced traveller information services, US DoT and ITS joint Program, 2003, pages: 247–254.
[3] Haiguang Li, Zhao Li, Robert T. White, and Xindong Wu (2013). A real-time transportation prediction system. Applied Intelligence 39, 4, December 2013, pages:793-804
[4] Donald G. Morrison, David C. Shmittlein (1988). Generalizing the NBD Model for Customer Purchases: What are the implications and is it worth the effort?, Journal of Business
& Economics Statistics, April 1988, Volume 6, N°2
[5] Zhang, J., Wang, F. Y., Wang, K., Lin, W. H., Xu, X., & Chen, C. (2011). Data-driven intelligent transportation systems: A survey. Intelligent Transportation Systems, IEEE
Transactions on, 12(4), pages:1624-1639.
[6] Birtolo, C., Diessa, V., De Chiara, D., Ritrovato, P. (2013), Customer churn detection system: Identifying customers who wish to leave a merchant. In: Ali, M., Bosse, T.,
Hindriks, K.V., Hoogendoorn, M., Jonker, C.M., Treur, J. (eds.) IEA/AIE 2013. LNCS, vol. 7906, Springer, Heidelberg, pages: 411–420.
[7] Shevade, S., Keerthi, S., Bhattacharyya, C., Murthy, K. (1999). Improvements to SMO algorithm for SVM Regression. Technical report, National University of Singapore, Control
Division Dept of Mechanical and Production Engineering, National University of Singapore, Technical Report CD-99-16.
[8] Fader, P.S., Hardie, B.G.S., Lee, K.L. (2005). “Counting your Customers” the easy way: An alternative to the Pareto/NBD Model. Marketing Science 24(2), pages: 275–284.
[9] Chen, W., Guo, F., Wang, F.-Y. (2015). A Survey of Traffic Data Visualization, in Intelligent Transportation Systems, IEEE Transactions on , no.99, pages: 1-15.
[10] H. Piringer, M. Buchetics, R. Benedik (2012). AlVis: Situation awareness in the surveillance of road tunnels. In Proc. IEEE Conf. Visual Anal. Sci. Technol., 2012, pages:
153–162.
( Cosimo Birtolo )